Admin Insights and Analytics
The Insights hub gives admins a comprehensive view of team health, engagement patterns, recognition activity, and growth metrics. It is organized into nine tabs, each covering a different analytics domain.
Accessing Insights
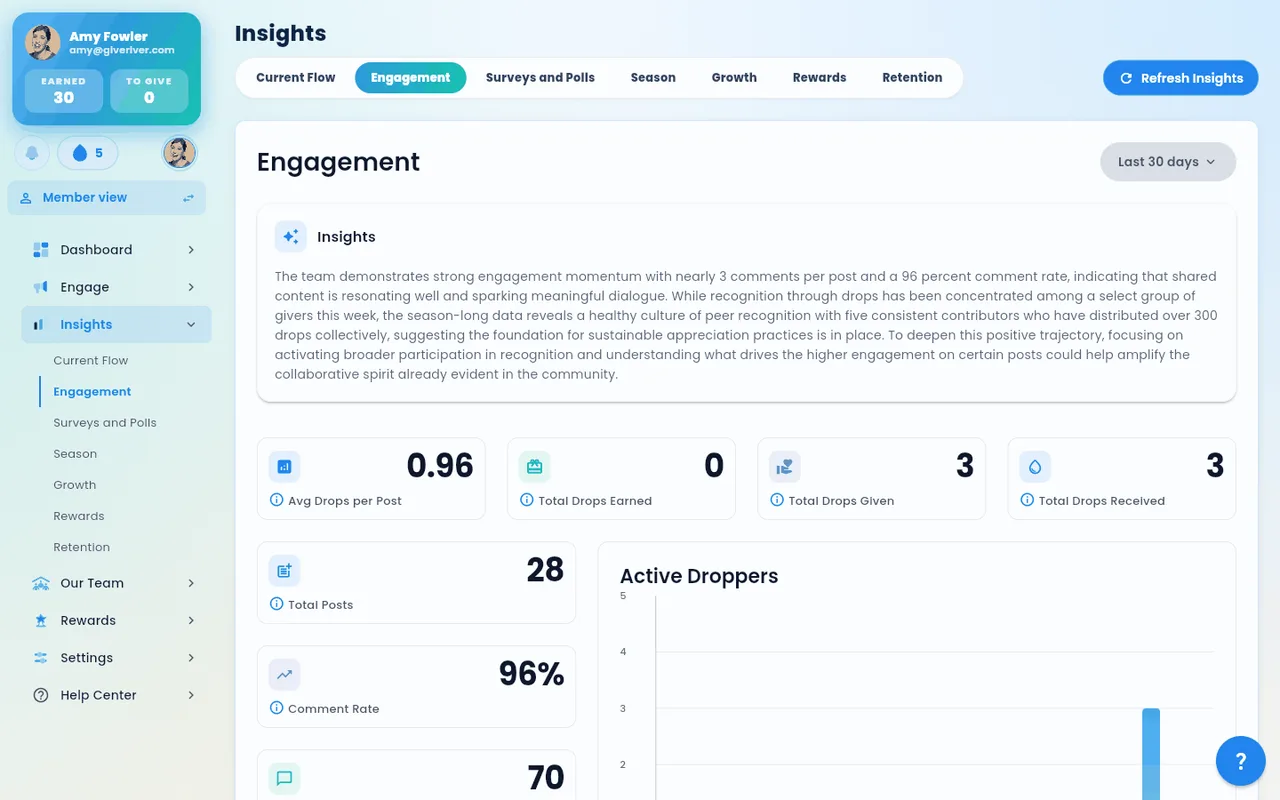
Navigate to Insights in the main sidebar. Data for all tabs loads automatically when the page opens. Use the Refresh Insights button in the top-right corner to pull the latest data at any time.
Insights Tabs
| Tab | What It Shows |
|---|---|
| Current Flow | Real-time recognition flow stage, participation rate, recent droppers, drops earned, and a drops activity chart |
| Engagement | Team activity stats, active droppers chart, top team moment, weekly drops comparison, top droppers leaderboard, top tags, and optional Slack analytics |
| Surveys | List of surveys with response analytics; click any survey to see detailed per-question results. Includes an eNPS panel for active eNPS series (gauge, score, breakdown). |
| Polls | Poll response data and participation metrics |
| Season | Season-level analytics; click any season for a detailed breakdown |
| Goals | SMART-goal adoption and outcomes: participation rate, completion rate, average progress, pending approvals, drops paid through goals, active goals by pace, a goals-completed-per-week trend chart, and a category breakdown |
| Growth | River Runs enrollment, completion rates, completion percentage, category breakdown pie chart, and a full River Runs overview table — exportable to CSV |
| Rewards | Rewards activity and redemption insights |
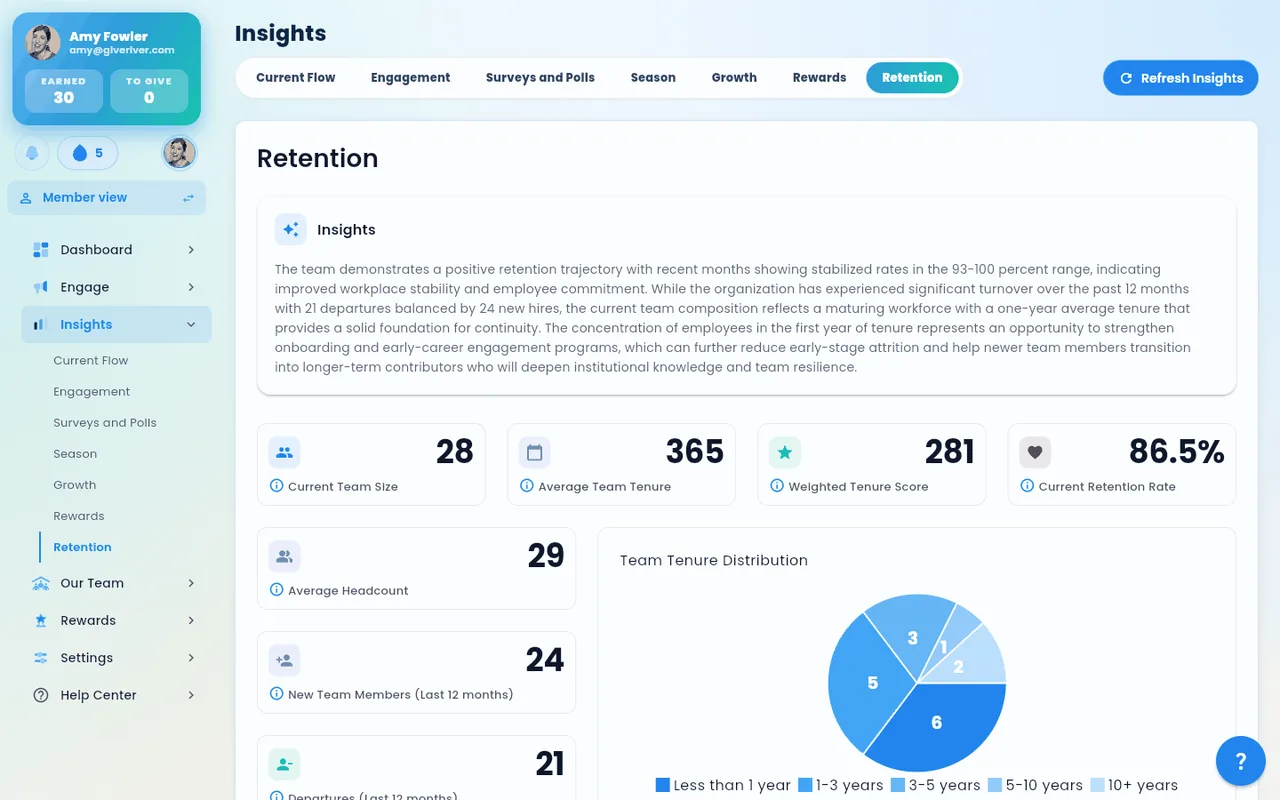
| Retention | Team size, tenure distribution, retention rate, new members, departures, and a stabilized retention rate chart |
Date Filtering
The Current Flow, Engagement, and Growth tabs each include a date range dropdown. Options include preset periods (This Week, This Month, Last Week, Last Month), All Time, and Custom Range. Choosing All Time removes the date bounds so the chart reflects your team's entire history; choosing Custom Range reveals start and end date pickers.
To filter by date:
- Open the relevant tab (Current Flow, Engagement, or Growth).
- Click the date range dropdown in the top-right of the section header.
- Select a preset period, All Time, or Custom Range (then set your dates).
- The chart and stat cards update automatically.
Section Headlines
The Current Flow, Engagement, Growth, Rewards, and Retention tabs open with a storytelling headline: the section's single most important number in large type, followed by a plain-language sentence explaining what it means for your team. Where the data references content the app has imagery for — River Run covers on Growth, reward images on Rewards — small thumbnails appear alongside the headline.
AI Insight Cards
Most tabs display an AI Insights card near the top of the section (below the headline). This card analyzes the current data and surfaces a short, plain-spoken summary written for team leaders. AI cards appear for:
- Current Flow
- Engagement
- Growth (River Runs)
- Retention
- Season analytics detail view
- Survey analytics detail view
The AI card generates its summary based on the data currently loaded. If no data is present for the selected period, the AI card does not appear.
Key Metrics by Tab
Current Flow
- Rapid Ratings stage — which of the flow stages your team is currently in
- Participation % — percentage of members who have given a drop in the current period
- Recent Droppers — count of members who dropped recently
- Drops Earned — total drops earned in the period
- Drops Activity chart — time-series visualization of drop volume
Engagement
- Average drops per post
- Total drops earned, given, and received
- Total posts and comment rate
- Active droppers bar chart
- Top team moment (most-engaged post)
- Weekly drops comparison (current vs. prior period)
Retention
- Current team size
- Average tenure (days)
- Weighted tenure score
- Current retention rate
- New members and departures (last 12 months)
- Team tenure distribution chart
- Stabilized retention rate chart over time
Growth (River Runs)
- Total enrolled runs
- Total completed runs
- Run completion rate
- River Runs categories pie chart
- River Runs overview table with per-run enrollment, completion, and completion rate
To export Growth data, click the Export CSV button that appears when data is present. Confirm the export in the dialog, and the file downloads to your device.
Surveys (including eNPS)
- Surveys list — every survey with response count and completion rate.
- Per-survey detail view — click any survey to see per-question response breakdowns, charts, and (where applicable) the AI Survey Insights Report.
- eNPS panel — appears when an active eNPS series exists for the team. See the Surveys (including eNPS) article for setup; this section covers what you see in Insights:
- Speedometer gauge — current eNPS score from −100 to +100 with color-coded zones for Detractors, Passives, and Promoters.
- Score number — the current eNPS, prominently displayed alongside the gauge.
- Breakdown — counts and percentages of Promoters (scored 9–10), Passives (scored 7–8), and Detractors (scored 0–6) across the most recent response set.
- Trend chart — score over time across the series, so you can see whether sentiment is improving, holding, or declining.
- Series detail — click an eNPS series in the Surveys list for per-occurrence response rates, score deltas between occurrences, and other series-level analytics.
What's New on Insights
Recent additions across the Insights tabs:
- Growth → Team Reach card — a new top-level stat card surfacing how broadly your team's recognition is reaching across members and groups.
- Surveys → Surveys Sent vs Response Rate — a twin-line chart that overlays send volume and response rate on the same time axis so you can see whether response rate is holding as you scale send volume.
- Surveys → Current Response Rate — a headline card showing the live response rate for the most recent send.
- Polls → Poll Responses time-series — a chart showing poll response counts over time across all polls in the period.
- Stats cards refresh — the headline-number cards on every Insights tab were redesigned: larger numbers, less whitespace, easier to scan at a glance.
- On-scroll animations — Growth, Current Flow, Retention, Rewards, and Season sections fade/slide in as they scroll into view, so the page reveals progressively rather than all at once.
Refreshing Data
Click Refresh Insights (top-right, all tabs) to reload all analytics data simultaneously. A spinner indicates the refresh is in progress. A toast notification confirms success or failure.
Did this article help?
Related articles.
See the platform in action.
30-day free trial. No credit card. River Guide included on Core and Growth.